Numbers
Proof, definitions,
and how I tracked it.
Peak metrics are only useful if you can explain what they mean and how they were measured.
$250,000+
Cumulative revenue (2022–2024)
Verified on resume
268%
YoY sales growth (2022 → 2023)
Verified on resume
+55%
Follower interaction lift (2023)
Verified on resume
Definitions
What each metric means
Revenue
Total sales collected from customers across all channels.
TrackedLogged per transaction; reconciled weekly.
Profit
Revenue minus cost of goods, fees, shipping, and event costs.
TrackedPer-pair margin notes + monthly rollups.
Velocity
How quickly pairs sold after acquisition (time-to-sale).
TrackedAcquired date → sold date; median tracked.
Sell-through
Percent of inventory sold within a defined window (ex: 30 days).
TrackedSold pairs / listed pairs (time-bucketed).
Engagement lift
Increase in interactions (likes, shares, saves, comments) during peak posting cadence.
TrackedIG Insights snapshots around drops/events.
Proof
Artifacts
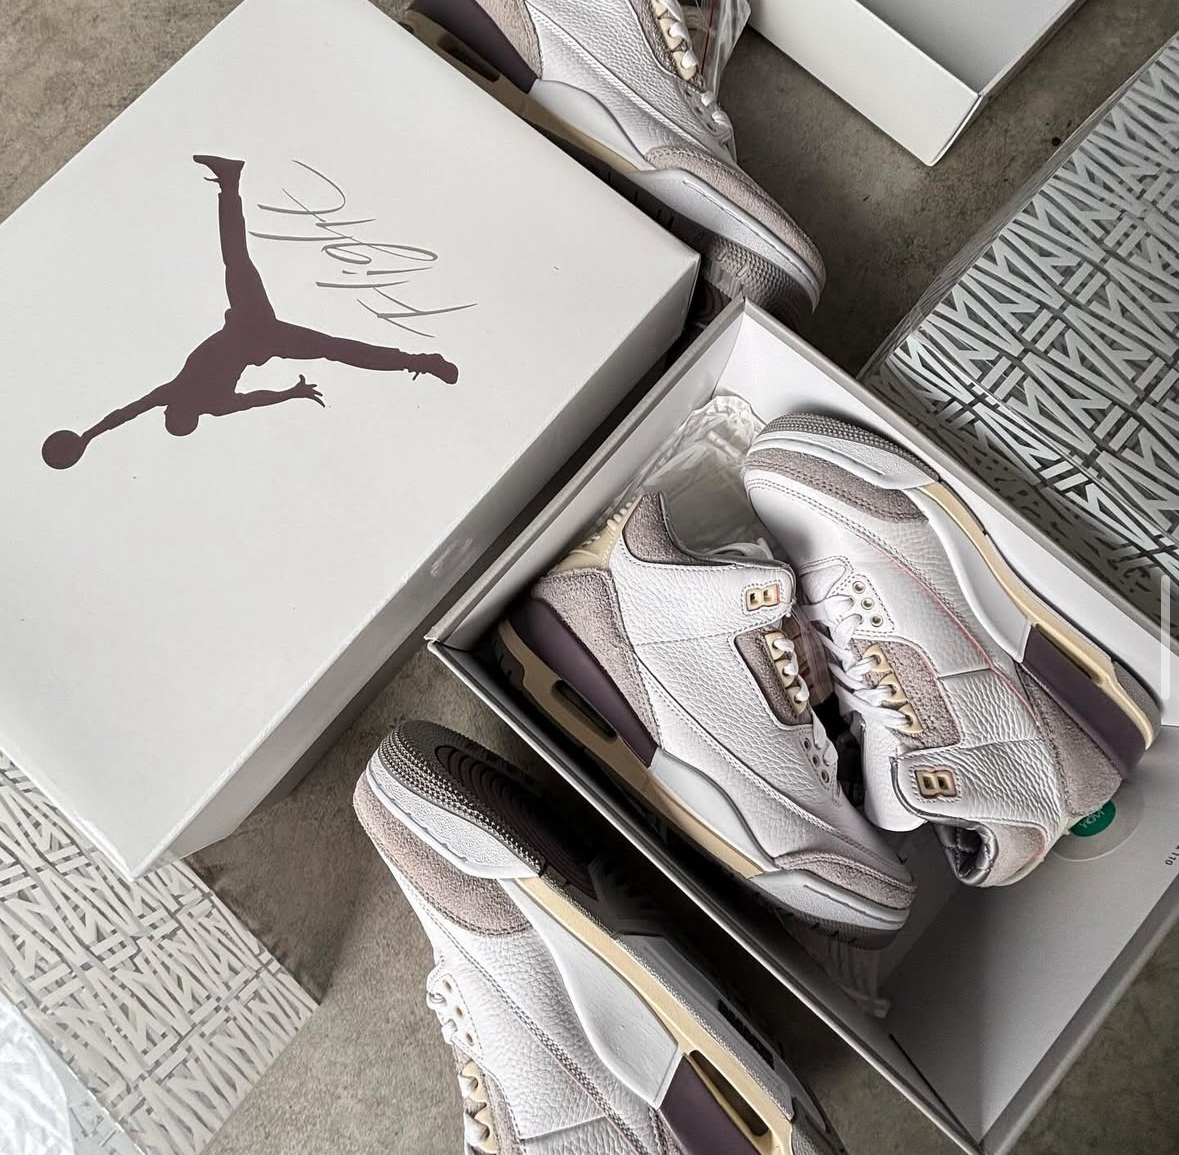
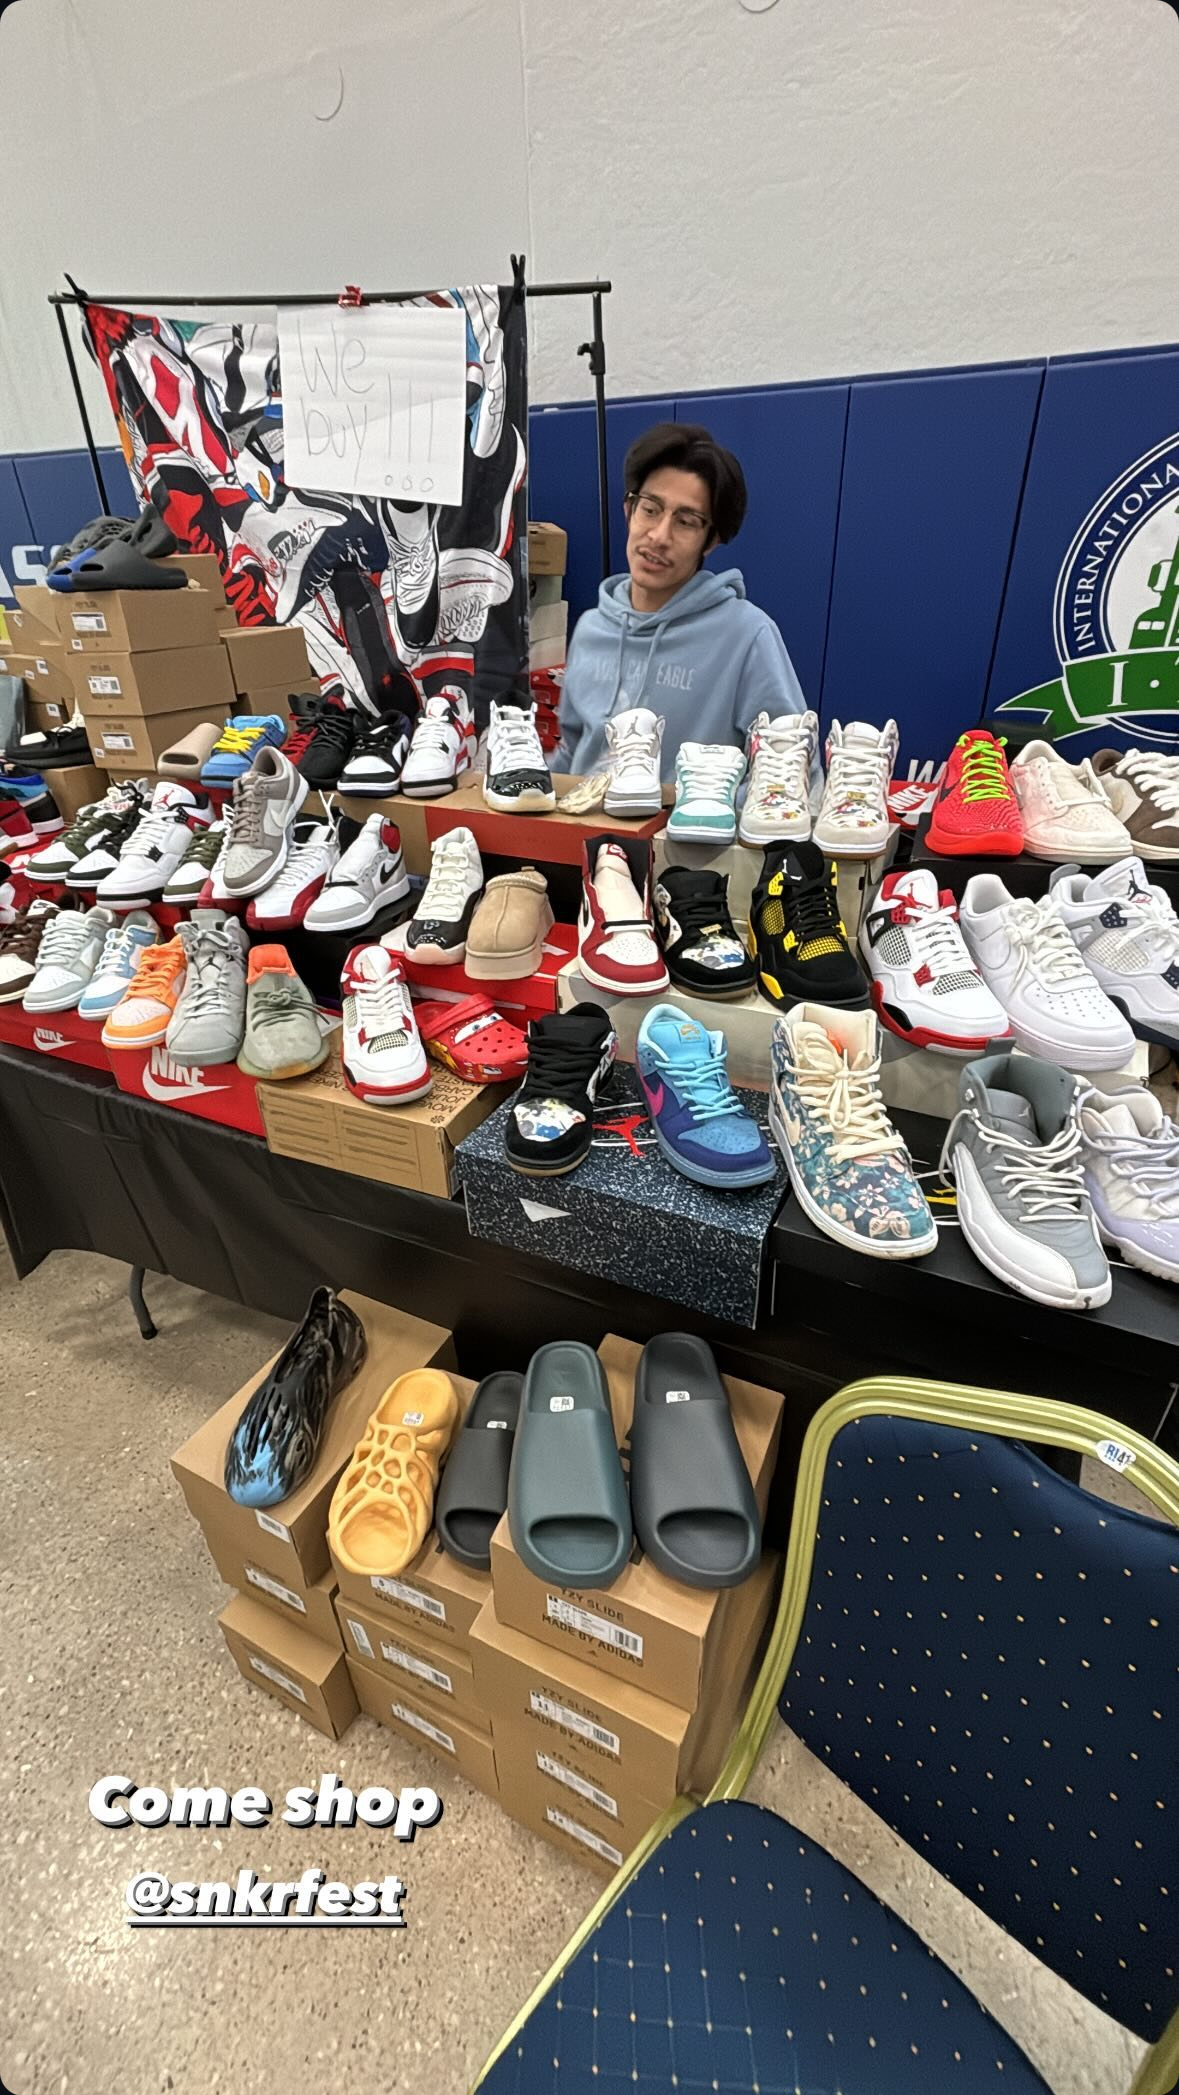
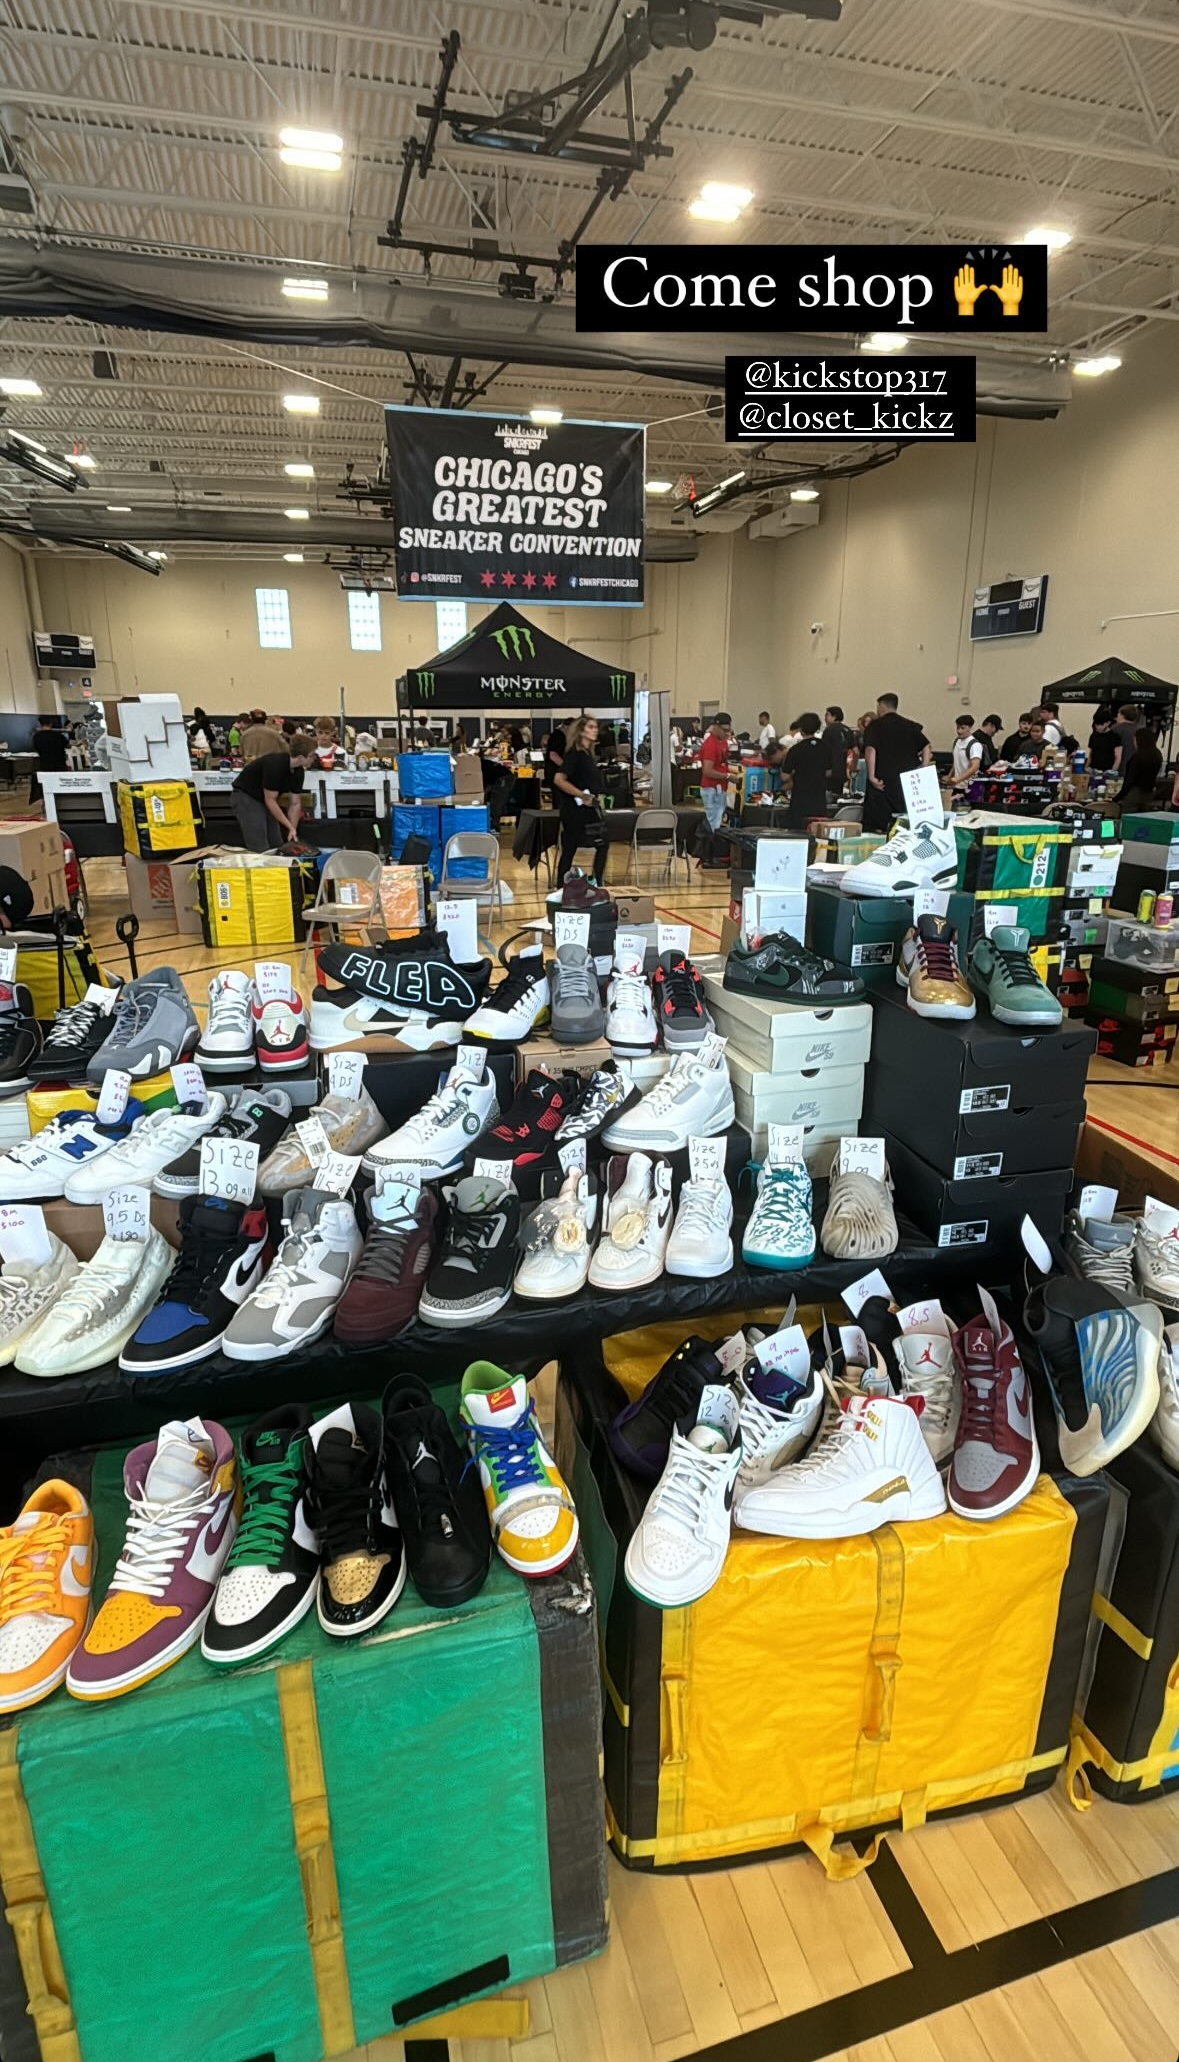
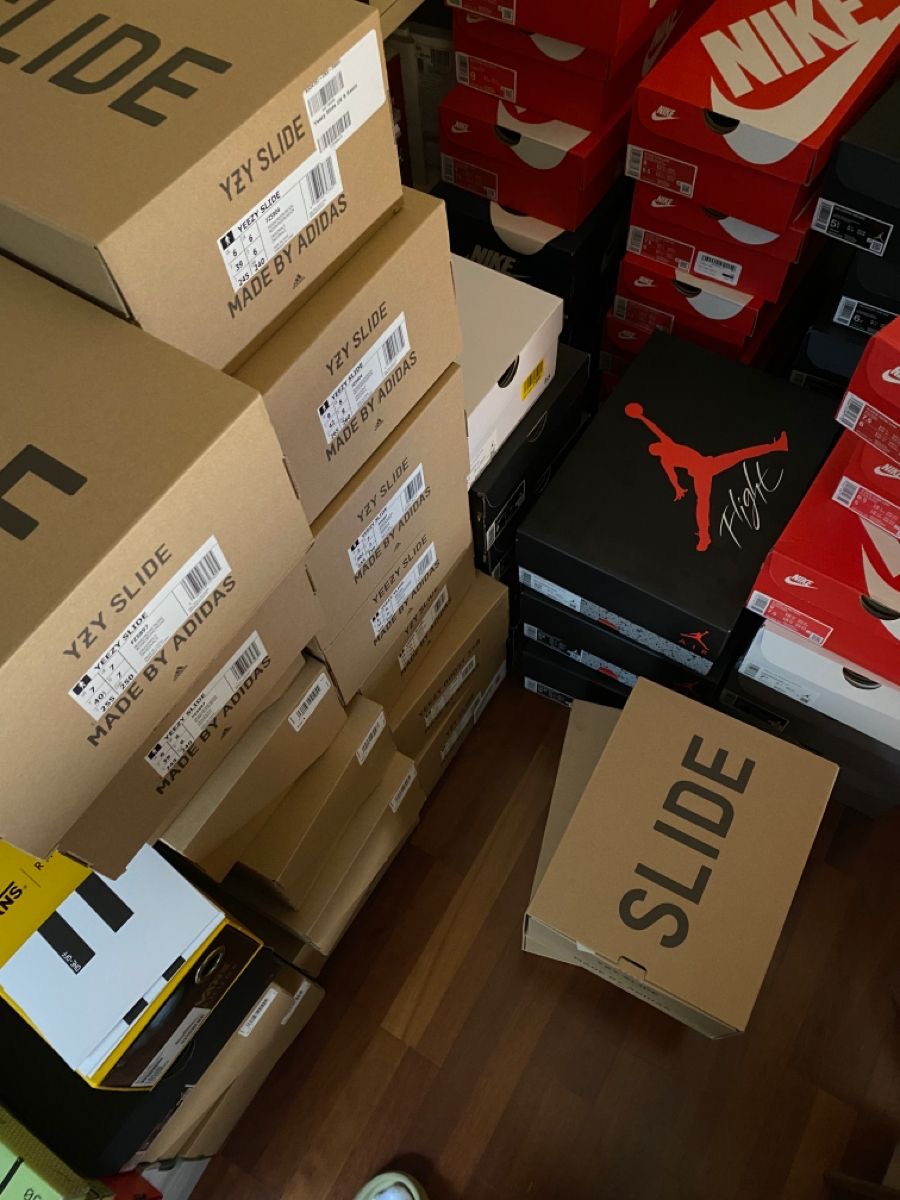
Click to open full size.
Operating model
How the machine ran
Sourcing
- Inbound sellers + campus network
- Sneaker events for bulk opportunities
- Buy box: liquidity + spread + condition
Pricing
- Reference comps (GOAT/StockX/eBay sold)
- Price to move inventory (velocity > max margin)
- Adjust after 48–72h if no traction
Fulfillment
- Friday drops → weekend meetups/shipping
- Packaging batch workflow (labels + QC)
- Track disputes/returns and bake into margin
Next
Want the raw breakdown?
Happy to share the spreadsheet structure, sourcing logic, and how I measured performance.